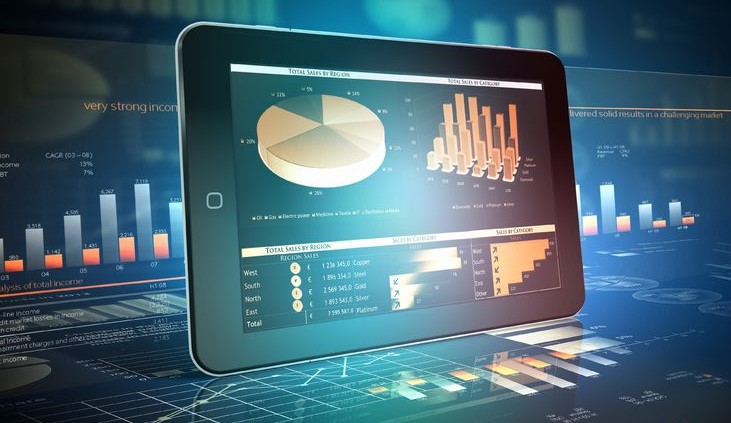
Data visualization software that offers full-size power for any size budget.
Get fast answers to complex questions using data of any size including big data in Hadoop. Guided exploration makes it easy. In-memory processing makes it fast. Advanced data visualization tools make it clear. Scalability makes it the perfect fit. And the price makes it within your reach.
Visually explore all relevant data smartly, quickly, easily. Interactive data discovery lets you look at all options. Find out why something happened. Identify critical drivers. The software automatically highlights key relationships, outliers, clusters, trends and more, guiding you to critical insights that inspire action.
Quickly create dazzling interactive reports and dashboards. Then easily share them via the web, mobile devices and Microsoft applications. Recipients can slice and dice to arrive at relevant information using filters and drill-through capabilities.
Do you want Selatan to contact you to discuss your business needs? Just fill up the form below and we will be in touch with you
Email Us at info@selatan.com.my